Chapter 5: EasyQoS Monitoring (Beta)
For APIC-EM release 1.6, EasyQoS Monitoring is a Beta feature. The Monitoring feature provides the ability for the network operator to monitoring the health of WAN-connected interfaces on routers to which EasyQoS policy has been applied. Health scores are based solely on packet loss for this release. Future versions of EasyQoS Monitoring may extend the functionality to include additional parameters such as end-to-end latency, jitter, application latency, etc. into the overall health score.
Enabling the Monitoring Feature
The Monitor feature is enabled per policy scope via the sliding button adjacent to Monitoring within the EasyQoS policy screen, as shown in the following figure.
- Enabling EasyQoS Monitoring
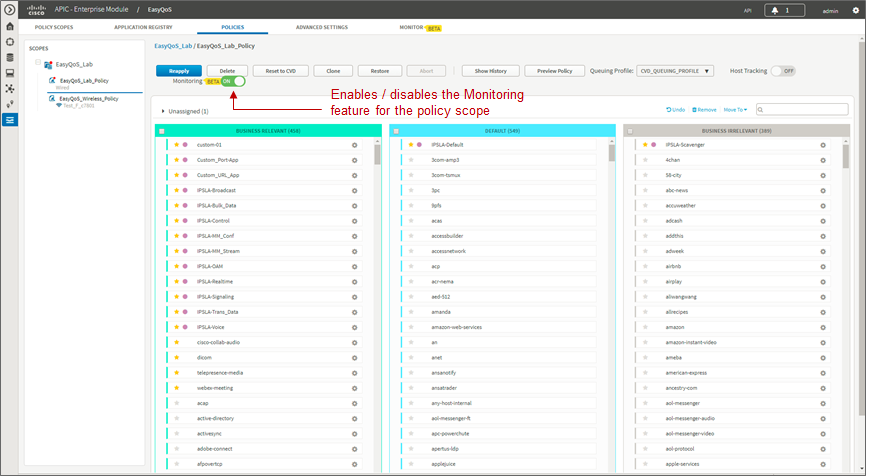
The EasyQoS policy should be re-applied to the policy scope after enabling the Monitoring feature. The Monitoring feature will add the following interface-level configuration command to all WAN-facing interfaces on ASR 1K, ISR 4K, ISR G2, and ISR 800 Series routers which support an Active NBAR2 license.
ip nbar protocol discovery
This command is necessary in order to display per-application statistics on ISR and ASR router platforms when drilling down into an interface. This feature will be available in future releases.
Device-Level Statistics
Device-level statistics may take approximately 20 minutes to appear after enabling the Monitoring feature. This is because EasyQoS polls statistics collected on the WAN interfaces periodically (by default every 10 minutes). Information is not displayed within the GUI until at least two polling cycles have passed.
After the Monitoring feature has been enabled, the network operator can click the Monitor tab in order to bring up a device-level view, as shown in the figure below.
- Device Level Statistics with All Traffic-Classes Selected
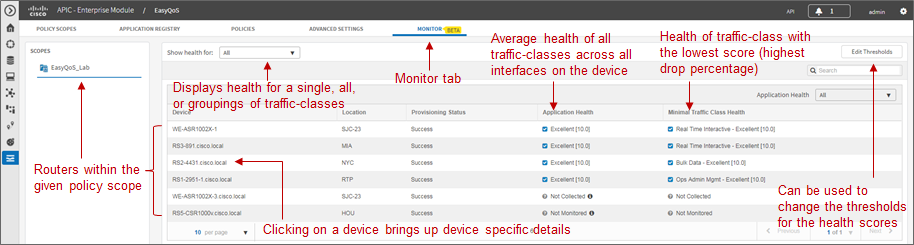
The device-level view displays the router platforms within the selected policy scope, and the status of the Monitoring feature on those devices. Application health can be displayed for all traffic-classes, a single traffic class, or groups of traffic-classes (Data, Video, or Control). The network operator can select this through the drop-down menu next to the Show health for: field, shown in the figure above.
If all traffic-classes have been selected, the Application Health column in the figure above represents the arithmetic mean (average) of the health scores across all traffic-classes and WAN interfaces for the given router. The Minimal Traffic Class Health column displays the traffic-class with the minimal application health score on the given router. Status for these columns can be one of the following:
- An application health score is being generated for the router platform. This indicates that monitoring statistics are being collected on one or more interfaces on the router.
- Not Monitored. This status indicates the router is not being monitored. This status can occur if the router does not support NBAR—meaning it does not have an Active NBAR license—or does not have any WAN-connected interfaces.
- Collection Failure. This status indicates there was an error in collecting statistics from the device for the previous cycle. Therefore the health score could not be calculated.
- Not Collected. This status indicates that no monitoring statistics are being collected for the router. In this situation, the router is capable of being monitored. However, monitoring statistics are not available because either the first health data sample was not collected or the number of monitored interfaces exceeds the supported number of 1,000 interfaces.
- Note: Application health scores are calculated based upon the percentage of drops within each traffic-class over the previous collection interval. By default, the collection interval is 10 minutes. Therefore, the application health score shows the health over the past collection interval only. There is currently no history, regarding application health scores, maintained within APIC-EM. Future versions of the Monitoring feature may extend this functionality to provide the network operator the ability to view historical health scores over selected time periods.
The application health score consists of both a ‘grade’—Excellent, Good, Fair, Poor, Bad, or Critical—which is based upon configurable drop thresholds, and a value from 0.0—10.0. The application health score is based upon the percentage of packet drops seen within each of the traffic-classes configured on the WAN interfaces of the router.
If a single traffic-class is selected, then only a single health score column appears in the device-level view, as shown in the figure below.
- Device-Level Statistics with Single Traffic-Class Selected

The drop-down menu adjacent to Application Health allows the network operator to filter the output based on the status for the router. For larger deployments this may assist in identifying areas of trouble more quickly. For example, it may be desirable to display only those routers that have a status of collection failure. This would indicate some problem with the collection of health scores on the devices displayed. Alternatively, the network operator may wish to display routers with a health score of critical, in order to allocate resources toward troubleshooting the routers with the most immediate issues first.
Sensitivity Factor and Health Score Thresholds
The network operator can view and modify the thresholds for each traffic-class used to calculate the application health score by clicking the Edit Thresholds button shown in the figure above. This brings up the Health Score Thresholds popup window shown in the figure below.
- Modifying Health Score Thresholds
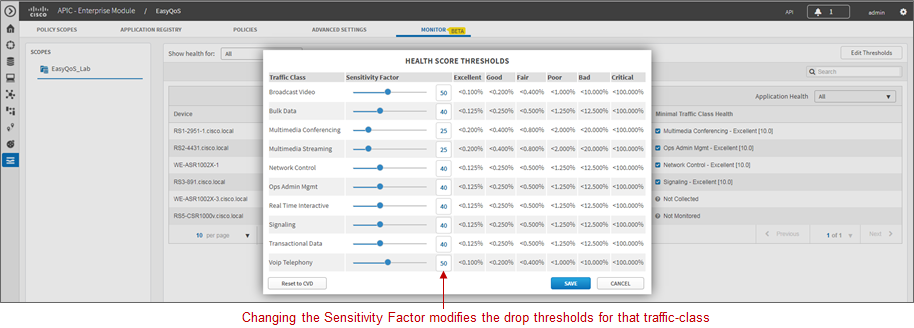
For each traffic-class, the network operator can modify the Sensitivity Factor—either via the slider, or by typing in a value in the box adjacent to each traffic-class. The Sensitivity Factor is used to set the maximum drop percentages acceptable for each of the thresholds (Excellent, Good, Fair, Poor, Bad, and Critical). It has a range from 0 to 100.
The default values for the Sensitivity Factor for each traffic-class are derived from industry standards. In particular, IETF RFC 4594 specifies the expected tolerances to packet loss for each of the 12 traffic-classes—as shown in the following table.
- Service Class Characteristics from IETF RFC 4594
| Service Class Name | Tolerance to Loss |
|---|---|
| Network Control | Low |
| Telephony | Very Low |
| Signaling | Low |
| Multimedia Conferencing | Low-Medium |
| Real-Time Interactive | Low |
| Multimedia Streaming | Low—Medium |
| Broadcast Video | Very Low |
| Low-Latency Data (Transactional Data) | Low |
| OAM | Low |
| High-Throughput Data (Bulk Data) | Low |
| Standard (Best Effort/Default) | Not Specified |
| Low Priority Data (Scavenger) | High |
- Note: Based upon IETF RFC 4594, the tolerance to packet loss for the Default (Best Effort) traffic-class is not specified. Additionally, the tolerance to packet loss for the Scavenger traffic-classes is high. Application health scores for these two traffic-classes are therefore not collected, and there is no Sensitivity Factor setting for these two traffic-classes.
The baseline for traffic-classes with Very Low tolerance to packet loss (Telephony and Broadcast Video) is aligned with the ITU-T Y.1451 specification at less than 1 in 1,000 packets (<0.100%) for Excellent quality.
The Sensitivity Factor for the VoIP Telephony and Broadcast Video traffic-classes is set to a value of 50 by default. This is the middle of the range of values from 0 to 100. All of the default values for the Sensitivity Factor for the other eight traffic-classes listed in the Health Score Thresholds popup window are derived from this—based upon the tolerance to packet loss (Low, Low-Medium, or High) of the specific traffic-class. The application health thresholds shown in the Health Score Thresholds window in the figure above are then derived based upon this.
Tuning of the Sensitivity Factor of individual traffic-classes within the Health Score Thresholds popup window allows the network operator to tune the output of the Monitoring feature in situations where the industry standard values do not specifically fit his/her environment. The higher the value of the Sensitivity Factor, the less tolerance to queue drops for the given traffic-class. If at any point, the network operator wants to revert to the default settings of the Sensitivity Factor for each traffic-class, he/she can simply click the Reset to CVD button in the lower left corner of the popup window. When the network operator is satisfied with the tuning, he/she can click the Save button to save the changes and close the popup window.
Device Details
Clicking a specific router shown in the Monitoring tab screen will bring up details for that particular device. An example is shown in the figure below.
- Monitoring Device Details
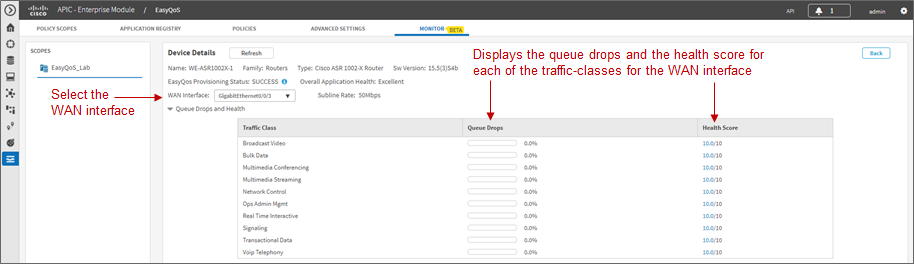
The Device Details screen displays the queue drops per traffic-class for the selected WAN interface on the router. It also displays the health score per traffic-class, based upon the percentage packet loss and Sensitivity Factor for a given traffic-class.
Per traffic-class queue drops for WAN interfaces are collected via the “show policy-map interface <interface> out” command, which is issued by EasyQoS to each WAN interface of monitored routers. An example partial output from the command is shown below.
WE-ASR1002X-1#show policy-map interface GigabitEthernet0/0/3 out

GigabitEthernet0/0/3

Service-policy output: prm-dscp#EQ\_SPP1-4Class#shape#50.0

Class-map: class-default (match-any)

48605130 packets, 5809744482 bytes

30 second offered rate 7000 bps, drop rate 0000 bps

Match: any

Queueing

queue limit 208 packets

(queue depth/total drops/no-buffer drops) 0/0/0

(pkts output/bytes output) 48523512/5803867986

shape (average) cir 50000000, bc 200000, be 200000

target shape rate 50000000

Service-policy : prm-dscp#EQ\_SPP1-4Class

queue stats for all priority classes:

Queueing

queue limit 512 packets

(queue depth/total drops/no-buffer drops) 0/0/0

(pkts output/bytes output) 730622/54226668

Class-map: prm-EZQOS\_12C#VOICE (match-any)

730622 packets, 54226668 bytes

30 second offered rate 0000 bps, drop rate 0000 bps

Match: dscp ef (46)

**police:**

rate 10 %

rate 5000000 bps, burst 156250 bytes

**conformed 730622 packets**, 54226668 bytes; actions:

transmit

**exceeded 0 packets**, 0 bytes; actions:

drop

conformed 0000 bps, exceeded 0000 bps

Priority: Strict, b/w exceed drops: 0

QoS Set

dscp ef

Marker statistics: Disabled

Class-map: prm-EZQOS\_12C#BROADCAST (match-any)

730592 packets, 54224448 bytes

30 second offered rate 0000 bps, drop rate 0000 bps

Match: dscp cs5 (40)

Queueing

queue limit 208 packets

(queue depth/\ **total drops**/no-buffer drops) 0/\ **0**/0

(**pkts output**/bytes output) **730592**/54224448

bandwidth remaining 8%

QoS Set

dscp af31

Marker statistics: Disabled
…
For traffic-classes which implement priority queuing, the policer configuration is used to determine conformed packets and exceeded packets for each collection interval. Packets which exceed the policer are configured to be dropped by EasyQoS. The queue drops per collection interval are calculated as follows:
Total Packets = Conformed Packets + Exceeded Packets
Δ Total Packets = Total Packets This Collection Interval – Total Packets Last Collection Interval
Δ Exceeded Packets = Exceeded Packets This Collection Interval – Exceeded Packets Last Collection Interval
Percentage Queue Drops = Δ Exceeded Packets / Δ Total Packets
The Exceeded Packets and Conformed Packets counters are highlighted in bold for the VOICE traffic-class in the sample output from the “show policy-map interface <interface> out” command above.
For traffic-classes which do not implement priority queuing, the queue drops per collection interval are calculated based upon Packets Output (Pkts Output) and Total Drops as follows:
Δ Pkts Output = Pkts Output This Collection Interval – Pkts Output Last Collection Interval
Δ Total Drops = Total Drops This Collection Interval – Total Drops Last Collection Interval
Percentage Queue Drops = Δ Total Drops / Δ Pkts Output
The Pkts Output and Total Drops counters are highlighted in bold for the BROADCAST traffic-class in the sample output from the “show policy-map interface <interface> out” command above.